
01
Reusable Power BI template
Open the .pbit file with its built-in demo, then connect your own workbook. Fourteen measures cover revenue, profit, margins, invoice counts, and operating expenses.
Small business · Power BI template
See what’s coming in, what it costs to deliver, and what remains after overhead. Turn your sales and expense workbook into a clear view of your business.
The complete dashboard package
Coming soon
Explore the report below. Pricing and purchase details will be posted when the dashboard is available.
Ask about this templateDigital Power BI template · Windows desktop
Explore actual report screenshots from Power BI Desktop. The controls here switch previews.
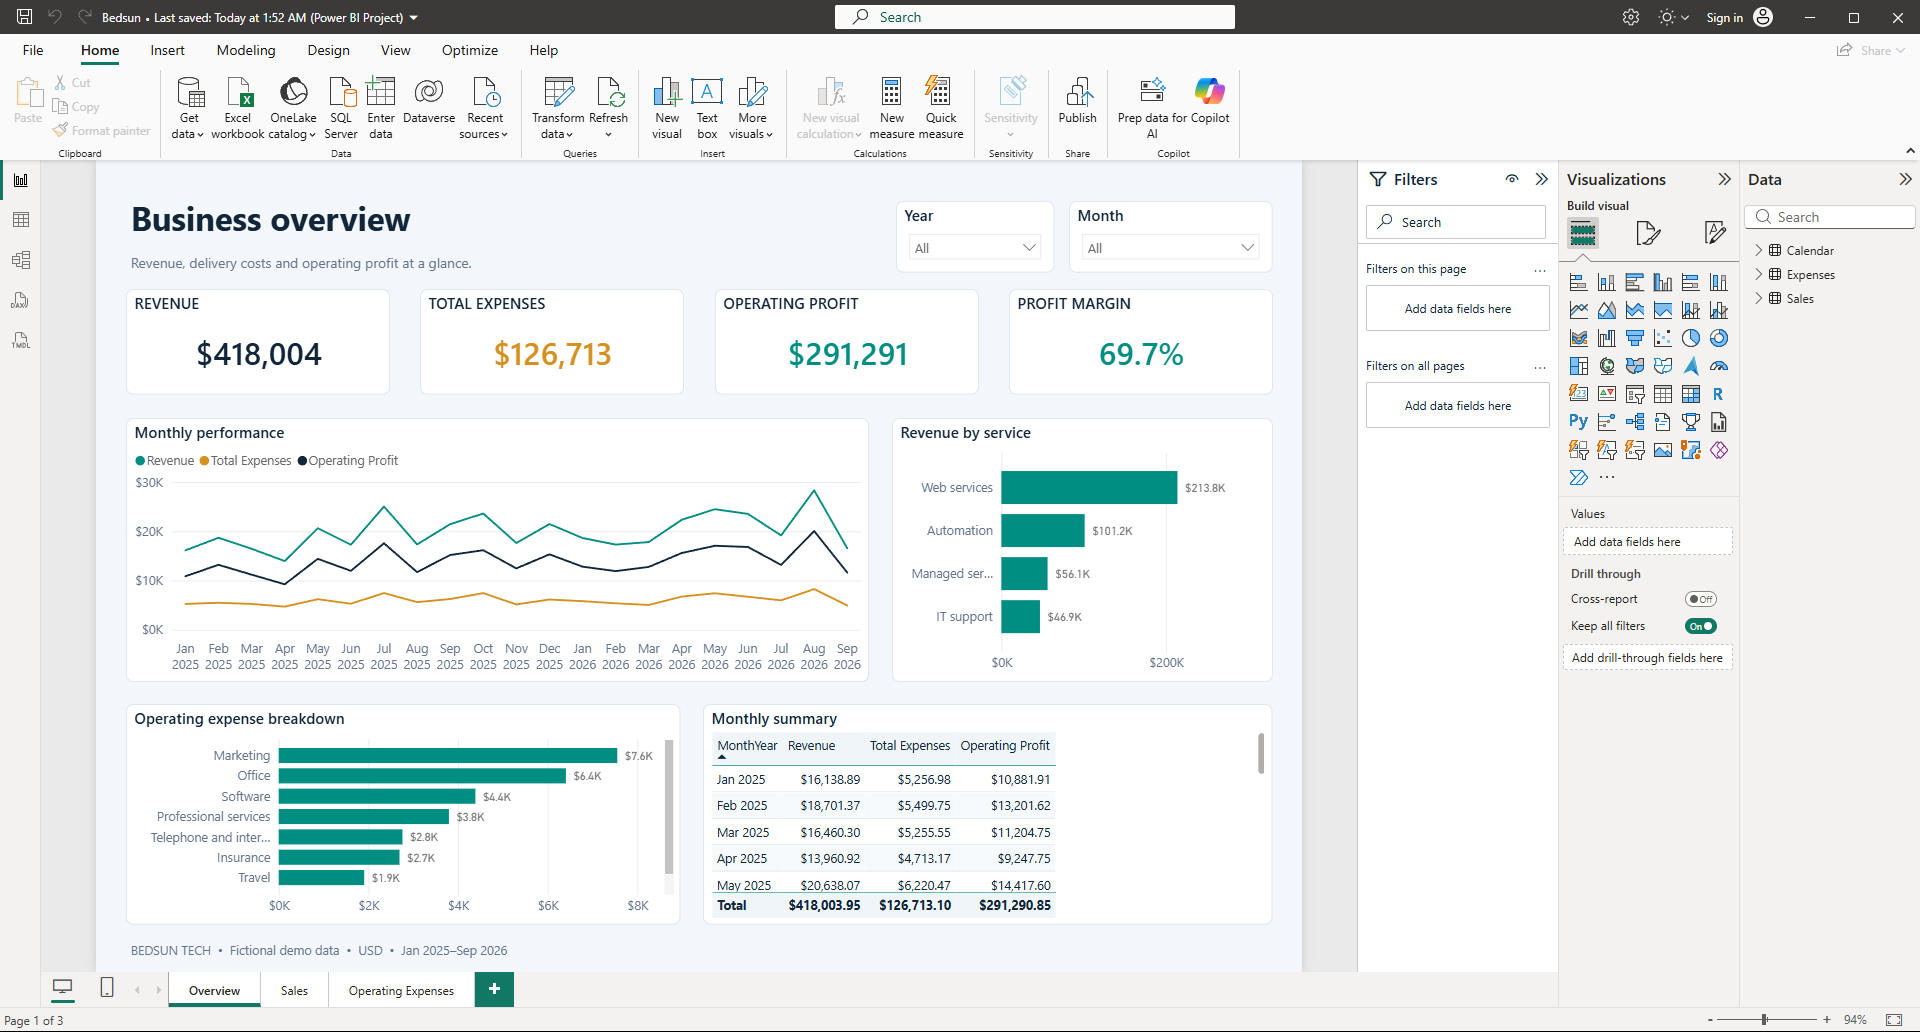
Revenue, total expenses, operating profit, and margin, with monthly trends and summaries.
Example data covers January 2025–September 2026 in USD. Open the full-size screenshot for a closer look on a small screen.
What’s inside
01
Open the .pbit file with its built-in demo, then connect your own workbook. Fourteen measures cover revenue, profit, margins, invoice counts, and operating expenses.
02
Two named tables keep sales and operating overhead organized. Replace the fictional rows while preserving the supplied column names, then refresh the report.
03
A three-page PDF and quick-start file explain setup, required columns, calculations, filters, and common refresh issues.
One ZIP containing a reusable .pbit Power BI template, a sample .xlsx workbook with Sales and Expenses tables, a three-page PDF buyer guide, and quick-start instructions. The template has Overview, Sales, and Operating Expenses pages with year and month filters.
Use Microsoft Power BI Desktop on Windows to open the template. You can view and refresh the report locally without signing in to the Power BI service. Online publishing and sharing have separate account and licensing requirements. This is a desktop template, not a hosted dashboard.
Yes. Open the .pbit template and leave DataFilePath blank to load the built-in fictional demo. The example covers January 2025 through September 2026 and uses USD. The blank-path demo has been opened and refreshed in Power BI Desktop.
Make a copy of the sample Excel workbook and replace its example rows. Keep the named Sales and Expenses tables and their column names. In Power BI Desktop, set DataFilePath to the full local path of your workbook and refresh. New rows are read on refresh; the buyer guide covers the setup.
Operating profit equals sales revenue minus invoice direct costs and operating expenses. Gross profit subtracts only direct costs. Keep direct costs out of the Expenses table so they are not counted twice. Operating overhead is shown at business level and is not allocated to individual services.
The included connection reads the two tables in your local Excel workbook. It does not include live bank feeds, accounting integrations, or scheduled online refresh. Update the workbook and refresh the report in Power BI Desktop.
Ask Matt about the template or connecting your sales and expense workbook.